
Summary
Measuring Team Effectiveness: Rigid metrics often paint a false picture and damage team performance. Attrition is not an early indicator, it is the receipt for problems that have already happened. Measure true team effectiveness by smartly combining different sources: one-on-ones, project lead rounds, and site averages. Learn how to identify blind spots, read your metrics correctly, and take action before your best people leave.
You do not need new metrics. You need to read the ones already running.
The request arrives from HR and consists of a number. Your attrition sits above target, please respond by Friday. You read the sentence twice, because you know exactly who left and why, and because none of those reasons is contained in the number.

The same number is sitting on the desk of a budget holder who has to decide on an intervention for your team. He sees a metric without meaning.
You have meaning without a metric. Most proposals fail in exactly that gap.
This article is for engineering and manufacturing leaders who have to justify an intervention for their team and do not want to fall back on instinct. Anyone looking for a ready-made system that renders team effectiveness as a single figure will be disappointed. None exists, and research has been showing why that is a good thing since 1956.
How I Measured in Prievidza Without Calling It Measurement
I always pushed back against rigid metrics
My reason was simple. The moment a metric has to be manufactured in order to exist at all, its explanatory power is limited. It stops measuring the work and starts measuring the organisation’s ability to produce that metric. In Slovakia I therefore built no additional system.

I measured anyway, every month
Attrition across my teams, monthly. What mattered was not the absolute figure. What mattered was the comparison with the average across the whole site. And there I was quietly proud, because my teams sat very low.
The difference between the number and what I knew
The HR calculation was the number on paper. Whenever somebody on my team moved on, I knew the circumstances. I saw more than a value: I knew what I, the team or that person now had to do, and what mattered in doing it. That is the whole difference between a metric and a basis for decisions.
The second source was the view from above
With the divisional heads at headquarters I held my monthly exchange. There I received detailed feedback on whether my team was meeting the expectations we had agreed beforehand. The decisive phrase is agreed beforehand. Without that agreement such a meeting is not a check, it is an assessment.
The third source was the one-to-one
In my one-to-ones I spoke with every direct report. That told me where these people stood in their work and how they felt about it. This source delivers what no number delivers: the state before the event. How I built that rhythm sits in the article on one-on-one meetings.
The fourth source was the project leads
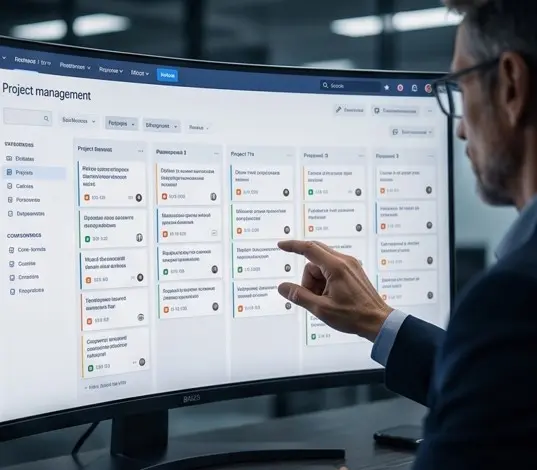
With them I rounded out the picture, because that is where we examined the project situations. I saw precisely which work package stood where, which problems had arisen, which had been solved and which were still waiting. Results alone would only have told me a date had slipped. This layer told me why.
The fifth source sat outside my own site
My team did not work on local projects alone. I therefore took that picture from the fortnightly project round held one level up in the reporting line.
Anyone who only knows their own view treats local friction as a local problem, and that is exactly where the reputation of a weak site gets made.

Why I needed no team health survey
I was so well connected with everyone that I noticed immediately when there were health issues. I did not have to wait for the next employee survey, because I was close and saw it directly. This honesty belongs with it though: that worked for 40 people on a fixed conversation rhythm. For 200 people across three sites, closeness alone no longer carries, and there you need the instrument. Anyone transferring my practice one to one onto a larger organisation ends up measuring nothing at all.
And the most important thing appeared in none of these sources

What really set my team apart was the effort when it was needed. The way they stuck together when one person could not manage alone and the others stepped in. Sometimes a weekend to finish something urgent. The trip to the customer or to headquarters to work directly where the problem sat. This behaviour cannot be measured. Its disappearance can, and it disappears long before attrition rises.
No sales conversation. If I am not the right person for you, you will hear that in the first five minutes.
What the Research Says About Metrics and Team Effectiveness
The damage rigid metrics do has been documented since 1956
V. F. Ridgway published a review of the dysfunctional consequences of performance measurement in Administrative Science Quarterly in 1956. Two of his cases describe precisely what I always pushed back against. Public employment interviewers were evaluated on the number of interviews they conducted, so they conducted fast interviews from which very few placements resulted. Investigators in a law enforcement agency were given a quota of eight cases per month and picked the easy cases towards month end.
Ridgway’s conclusion reaches further than most citations carry it. Single metrics are not the only source of damage. Multiple metrics force the individual into trade-offs between contradictory objectives, and composite metrics generate tension along with role and value conflicts. Quantitative performance measures are tools, and indiscriminate use arises, in Ridgway’s account, from insufficient knowledge of their side effects.

(Source: Ridgway, V. F. (1956), Dysfunctional Consequences of Performance Measurements, Administrative Science Quarterly, 1(2), 240-247.)
Why HR is nevertheless right to want an instrument
Gallup has measured at business unit level rather than individual level for decades. The inferential database behind the Q12 meta-analysis covers 736 studies for 347 independent organisations in its eleventh edition. The result is linked to eleven operational outcomes, among them turnover, safety incidents, absenteeism, quality defects, productivity and profitability.
That is the bridge this whole article turns on. Your HR function does not measure in order to judge you. It measures at the level where relationships to hard business outcomes can be demonstrated at all. In the ongoing meta-analysis covering 183,806 business units, top-quartile units achieved 23 percent higher profit than bottom-quartile ones. That is the language a budget holder thinks in.
(Sources: Gallup, Q12 Meta-Analysis, 11th edition; Gallup, World’s Largest Ongoing Study of the Employee Experience.)
And why the leader remains the decisive factor
Gallup calls one finding probably its most profound ever: 70 percent of the variance in team engagement is determined solely by the manager. Two teams in the same company, on the same pay, with the same tools and the same market, differ above all through the person leading them.
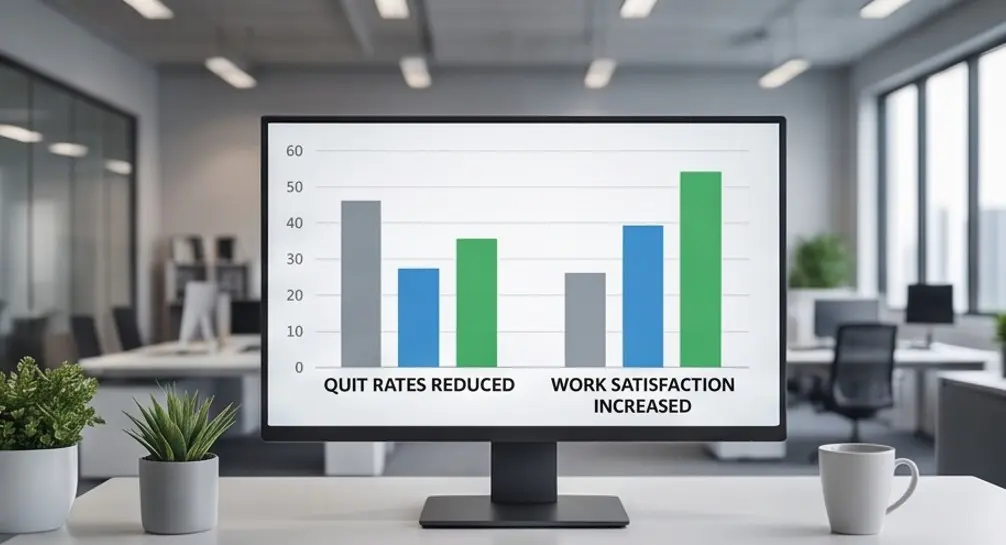
For your argument that means two things. The uncomfortable one: a metric about your team is to a considerable degree a metric about you. The useful one: a value that hangs largely on leadership can also be moved by working on leadership. That is exactly why a team charter workshop is not a soft intervention, it acts on the single largest lever available.
(Sources: Gallup, How Influential Is a Good Manager; Gallup, How to Improve Employee Engagement in the Workplace.)
The number that said the opposite
During my time in Prievidza a competitor bought my electronics team away one engineer at a time, with markedly higher salaries in a market where wages sat below German levels. Three people left. The attrition figure rose, and read from a distance it would have reported: leadership problem in electronics.

What actually happened was a salary market and families under pressure. I understood those decisions and let the three go with regret. What the department lost was competence and capacity for committed projects, and how we absorbed that sits in the article on breaking down silos. For this article only one thing counts: HR delivered the number, I delivered the meaning, and neither works alone. Replacing a senior engineer costs 150 to 200 percent of annual salary, but that cost arises regardless of whether the cause sat with leadership or with the market. Only the countermeasure differs, and you choose it wrongly when all you hold is the number.
(Sources: replacement cost per PLOS ONE and Accenture; Gallup on up to 59 percent lower turnover in engaged teams.)
Voices From Practice
Tanaya Deole has worked with me on both levels, individual and organisational. Her feedback sits here because she names that distinction herself, and it is the distinction any case for an intervention rests on.
Which Sources Actually Run for You?
Five sources carried my picture, plus one signal that appears in no report. None of them is a metric in the classical sense, and none carries alone. They only become measurement once you can read them against each other. Work through the six points for your own team. There are no points and no grade, only the blind spot that remains and the next step to close it.
Which of these sources actually run for you?
How to Make an Intervention Defensible
If you want to push through a team charter workshop or a comparable intervention, you do not need an efficacy study. You need a before state that exists in writing before the intervention starts. Four steps cover it.
Step one: fix three values before the intervention
Take values that are collected anyway, so that nobody has to do extra work. Your team's attrition against the site average, the schedule adherence of your work packages, and the number of items in the project lead round that have been waiting for a solution longer than four weeks. All three sit in systems that already exist. Anyone inventing new surveys creates precisely the manufactured metric Ridgway warns about.
Step two: agree the expectation in writing beforehand
Establish together with the budget holder which change, within which period, counts as success. This is uncomfortable because it commits you. It is also the only way to avoid ending up in an assessment whose yardstick somebody else chose after the fact. How to phrase such agreements so they hold sits in the article on goal setting.
Step three: bring the source that is not a number
Numbers alone rarely convince, because every budget holder knows they can be produced. Add a qualitative source that cannot be manipulated: two or three named situations from the project lead round where an item waited for a solution and nobody owned it. That is concrete, checkable and hard to dispute.
Step four: afterwards use the same three values, not new ones
The most common mistake is showing different values afterwards than before, because the new ones look better.
That loses you the argument permanently, even where the intervention worked. Use the same three, state openly what did not change, and explain why. That honesty buys you the next intervention.

And one warning to close
The moment you condense your sources into a single figure that somebody reports upwards, the same decay begins that Ridgway described in 1956. Keep the sources apart. Your advantage does not lie in a better metric, it lies in your ability to read several independent signals against each other. No dashboard can do that.

You leave with a phrasing you can use, not with a proposal.
Where Measuring Alone Is Not Enough
A clean before-and-after comparison replaces no work on root causes. If status stays green until the date slips, you are measuring past the green melon effect. If your team is arguing openly, that is not an effectiveness problem but most likely the storming phase. And if nobody contradicts you, what is missing is not the metric but psychological safety, without which even the best survey measures politeness. Google identified exactly that factor as the most important one for effective teams in Project Aristotle.
Priti Shahane leads the training academy at Brose in Pune and took part in one of our programmes. Her feedback sits here because it describes what impact actually rests on for participants, and that is rarely what ends up inside a metric.
How an intervention plays out in practice is visible in the case studies and the mentoring method. Terms from this article are defined in the leadership glossary, and the full toolkit sits in the methods overview.
FAQ: Frequently Asked Questions About Measuring Team Effectiveness
Q1: Which single metric measures team effectiveness best?
None. Ridgway showed as early as 1956 that single, multiple and composite performance measures all carry undesirable consequences. A picture only becomes reliable once several independent sources show the same thing. Four sources that confirm each other beat any individual metric.
Q2: Is attrition an early indicator?
No, it is a lagging one. By the time attrition rises the decision was made long ago and the knowledge has already left the building. As a comparison against the site average it stays valuable, because it shows whether your situation is unusual or simply follows the market.
Q3: What counts as a genuine early indicator then?
Behaviour that stops. When nobody helps a colleague unasked any more, when nobody pushes back in meetings, when items wait longer for a solution than they used to. Those signals run months ahead of the first resignation and appear in no report. You see them only if you speak regularly.
Q4: How do I convince a budget holder without hard numbers?
With three values that are collected anyway and a written expectation agreed before the intervention starts. Add two or three named situations that make the state concrete. What you should not do is claim an efficacy rate you cannot evidence.
Q5: Do I need an employee survey?
That depends on your span of control. For a team you speak to personally on a fixed rhythm, the conversation delivers the same information sooner. Across several sites or in markedly larger units, closeness alone no longer carries, and an instrument such as Gallup's Q12 becomes the only route to comparability.
Q6: Why does Gallup measure at business unit level?
Because relationships to business outcomes only appear there. Turnover, absenteeism, quality defects and productivity are recorded at that level anyway. The Q12 meta-analysis links 736 studies from 347 organisations to eleven such outcomes in its eleventh edition.
Q7: How much influence does the leader really have?
According to Gallup, 70 percent of the variance in team engagement is determined solely by the manager. That is uncomfortable and useful at once: a metric about your team is largely a metric about you, and precisely for that reason it can be moved by working on leadership.
Q8: What do I do when HR only sends a number?
Ask for the comparison value before you respond. Without the site average and a breakdown by department the figure cannot be interpreted. Then supply the meaning, meaning the known circumstances of each individual departure. HR holds the number, you hold the context, and the two belong together.
Q9: Can I simply read team health off absence rates?
Only to a limited degree, because absence depends on season, age structure and the nature of the work. As one source among several it is usable, as a single value it misleads regularly. The same applies to overtime, which can mean everything or nothing depending on the project phase.
Q10: How do I measure in distributed teams?
With the same sources and more effort on the qualitative ones. Since you lose the observation made in passing, you need fixed opportunities and access to the rounds at the other sites. More in the remote leadership method and in intercultural mentoring.
Q11: How long should I wait after an intervention before measuring?
A few weeks suffice for behavioural signals. For attrition you need at least twelve months, because it lags. Fix the timing beforehand, together with the budget holder. Choosing the measurement point after the fact loses you the argument even when the numbers are good.
Q12: What if my metrics look fine and I still sense a problem?
Then trust the instinct and go looking for the source that evidences it. Good numbers alongside a bad feeling usually mean a metric is being produced rather than measured. That is Ridgway's point exactly. Ask in the project lead round what is still waiting for a solution, because it surfaces there first.

About the Author: The Intersection of Three Worlds
Most providers are either a coach or a consultant. They know metrics from the analysis, not from carrying accountability for what those metrics measure. I have worked in all three worlds.

Executive leadership: 25 years of operational automotive DNA, 150 million euro of revenue accountability, an engineering site with 40 engineers built from a greenfield. Executive coaching: ICF PCC certified, more than 1,000 coaching hours.

Intercultural transformation: four years as the accountable leader in Slovakia, two years in Pune, alongside experience in Germany, China, Mexico and the United Kingdom.
The measurement system in this article is not off the shelf. It is what I ran a department with for four years, including the boundary at which it stops working. More about the path is on the page about Andy Balbus.
Results or Excuses?
The number landing in your inbox from HR tomorrow will be interpreted without you if you give it no meaning. Until then somebody decides about your team on the basis of a value whose origin they do not know. And the behaviour that actually carries your projects, the effort when it gets tight, appears in no report at all. It disappears quietly, long before the first resignation arrives.
In 30 minutes we go through which sources run for you and which one is missing, and you leave with three values to fix before your next intervention. I bring the view from leadership, coaching and cultural change at the same time.

One calendar link, no preparation required.
You can also reach me through the contact page. How the formats connect is visible in Accelerate Now, in executive coaching, in coaching for automotive leaders, in the legacy programme for owners and in Your Power Within. For leadership without formal authority there is mentoring without authority, for the role change mentoring from expert to leader, for growing spans mentoring for team leads and for strategic influence mentoring at director level. To dig into root causes, start with the extended workbench, the translation tax, micromanagement, the SOP delay and the chief firefighter syndrome. The SMART method, prioritisation, uncompromising delegation, active listening, the conflict architecture, the Gemba Walk, the article on the first leadership role, the one on no time for strategy and the Executive Sparring India page round out the set.
Systematic Leadership does not end with a phone Call.
Follow Andy for more Perspectives and Insights.


Leave a Reply